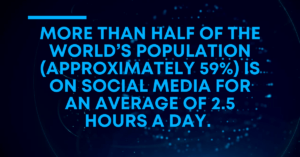
 So what’s the point of having infographics?
Sifting through pages and pages of text is not ideal in our fast-paced world. Who wants to read a lengthy article when they could comprehend information fast by looking at an awesome infographic!
Thanks to infographics, information can now be portrayed as fun, interesting, dynamic, colorful and many times — funny.
Finally, information is fun!
You can now find yourself learning about topics you never thought were interesting in the first place AND you’re sharing it with your friends.
So, here are a few tips to make your Infographic as described above.
1. Show, Don’t Tell.
As I mentioned above, people often prefer images to lengthy articles. If you are able to get your point across effectively in an image — perhaps by using icons — you’re golden.
2. Courageous Graphing.
Go beyond the typical pie charts and line graphs. Lets put it this way — go beyond Microsoft Excel. Display quantitative information in the most effortless way to comprehend— perhaps pictorially.
3. Tell A Story.
An infographic should lead you through a clear information journey. The beginning should explain what information the infographic is tackling and then walk you through it.
4. Clarity.
Perhaps this is one of the most important steps. Make sure the infographic makes sense, explains your points CORRECTLY, and looks sharp and clean. Remember, you are trying to portray information in a not so conventional way, you must be careful in doing so. Try sketching out your ideas first.
5. Accurate Data.
Ultimately, whoever views your infographic is expecting to receive current, accurate information. Double check that any computations are correct.
6. Source Your Data!
Make sure all your information is coming from a trusted source and that you are giving credit to these sources.
7. Think Outside the Box.
Try to be creative with your graphic, ultimately it is a work of art so make sure it follows creative graphic rules while staying true to its purpose. But don’t forget, the more creative you are, the more your viewer may: like and share your graphic.
I hope you find these tips helpful and are encouraged to start creating your own infographics.
Now go get started!
Sideqik Marketing
Latest posts by Sideqik Marketing (see all)
- The Coolest Things Tiktok Made Us Buy - November 10, 2021
- How to Prep Your Influencer Strategy for the Black Friday E-commerce Influx - November 8, 2021
- Building an Influencer Program From Scratch - March 12, 2019


